Student Mental Health Analysis
Project Information
- Category: Data Visualization / Statistical Research
- Client: Personal Project
- Project Date: November 2023 - December 2023
- Tools Used: Tableau, Google Forms (for data collection)
- Project URL: View on Tableau Public
A Statistical Research on the Effects of Mental Health on Students’ CGPA
Summary
This project features a statistical research and data visualization analysis using Tableau, exploring the relationship between students' mental health and their Cumulative Grade Point Average (CGPA). By analyzing survey data collected from university students via Google Forms, the goal was to understand how mental well-being factors (e.g., stress, anxiety, depression symptoms) influence academic outcomes. The interactive dashboards reveal key correlations, offering insights into areas where students may need more support for holistic success.
---1. Introduction
Mental health significantly impacts overall well-being and academic achievement among university students. Facing pressures from academic demands, social adjustments, financial stress, and future uncertainties, students' mental states can fluctuate. This project addresses this crucial topic by statistically exploring the effects of mental health on CGPA, aiming to provide insights for improving student support and understanding.
---2. Dataset & Methodology
2.1 Data Collection
The dataset for this research was collected through a Google Forms survey specifically designed and administered to a diverse group of university students. The survey aimed to capture self-reported data on various aspects of their academic and mental well-being. Key variables collected included:
- Demographics: Age, gender, year of study, academic major.
- Mental Health Indicators: Self-assessed levels of stress, anxiety symptoms (e.g., frequency of panic attacks), depression symptoms (e.g., feelings of hopelessness), and overall mental well-being score.
- Academic Performance: Self-reported Cumulative Grade Point Average (CGPA).
- Lifestyle Factors: Hours of sleep per night, daily study hours, frequency of social activities, perceived academic pressure, and family support.
2.2 Methodology
My approach involved a comprehensive multi-stage process to ensure robust analysis and meaningful insights:
- Data Cleaning & Preprocessing: The raw survey data was extracted from Google Forms into a structured format (e.g., CSV). I then performed extensive cleaning, which included handling missing values (e.g., imputation or removal based on context), standardizing text responses, converting data types as necessary (e.g., categorical to numerical for analysis), and identifying and addressing outliers to ensure data quality and consistency.
- Exploratory Data Analysis (EDA): Initial exploration involved generating descriptive statistics (means, medians, standard deviations) and creating basic visualizations (histograms, box plots) for each variable. This helped understand data distributions, identify initial patterns, and detect anomalies that informed subsequent statistical hypotheses.
- Data Visualization with Tableau: The core of the output involved leveraging Tableau Desktop to create dynamic and interactive dashboards. This encompassed connecting to the cleaned dataset, developing diverse chart types (e.g., bar charts for prevalence, scatter plots for correlations, line charts for trends, treemaps for distribution), implementing interactive filters and parameters for user-driven data exploration, and designing a clear, intuitive, and visually appealing dashboard layout to effectively communicate complex insights.
3. Project Objectives
This project aimed to:
- Quantify the prevalence of common mental health challenges, such as stress, anxiety, and depression symptoms, among the surveyed university student population.
- Demonstrate the statistical influence of mental health status on students' academic performance, specifically their Cumulative Grade Point Average (CGPA), identifying significant correlations.
- Pinpoint specific mental health and lifestyle factors that show the strongest associations with variations in student CGPA, providing granular understanding of contributing elements.
- Provide data-driven recommendations and actionable insights to assist educational institutions in developing more effective and targeted student support programs and policies aimed at improving both mental well-being and academic success.
4. Key Insights & Dashboard Features
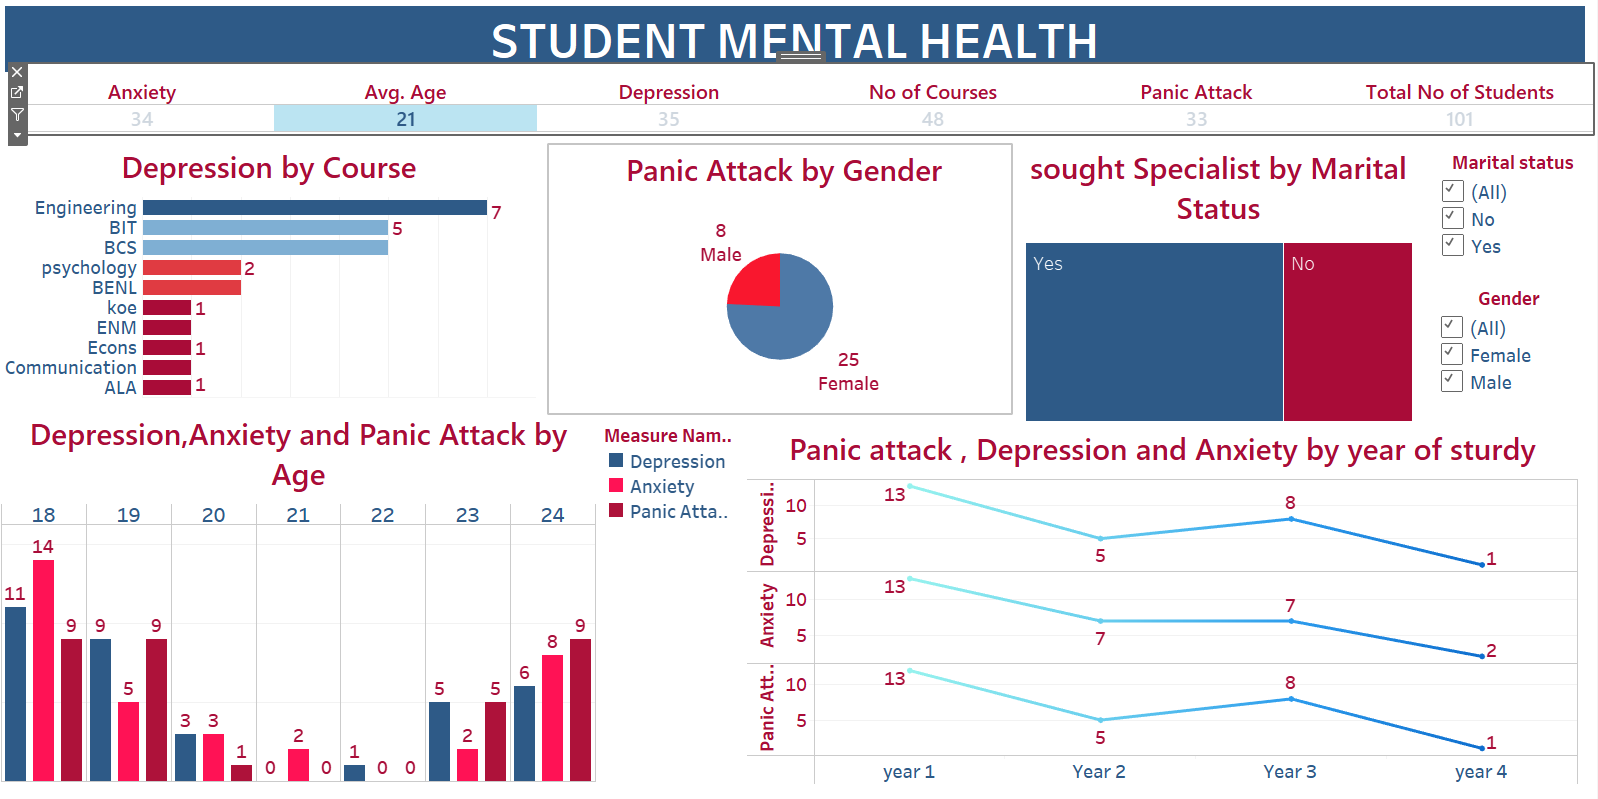
The Tableau dashboard provides a comprehensive view of the research findings, allowing interactive data exploration. Key features and insights include:
- Mental Health Status Overview: A treemap visualization on the dashboard clearly showed that "Moderate Stress" was the most reported mental health concern among students (35%), closely followed by "Mild Anxiety" (28%). This highlights a widespread need for accessible stress management resources.
- CGPA by Mental Health Category: A bar chart comparing average CGPA across different stress levels revealed a clear negative correlation. Students reporting "High Stress" had an average CGPA of 2.8, significantly lower than the 3.5 average for students with "Low Stress." Similarly, those experiencing "Frequent Anxiety" averaged a CGPA of 2.9, compared to 3.4 for students with "Rare Anxiety."
- Impact of Specific Factors: A scatter plot correlating 'Hours of Quality Sleep' with 'CGPA' illustrated that students consistently getting 7-8 hours of sleep tended to have higher CGPAs, with optimal performance peaking around 7.5 hours. Conversely, a stacked bar chart showing 'CGPA distribution by 'Study Habits'' indicated that students who felt "Overwhelmed by Studies" were disproportionately represented in the lower CGPA bands.
- Demographic Analysis: Interactive filters on the dashboard allowed for detailed demographic breakdowns. A line chart comparing 'Average Anxiety Levels by Year of Study' showed a gradual increase in anxiety from freshman to senior year, with a notable spike observed in the final year, suggesting heightened pressure as graduation approaches. Further analysis using a pie chart indicated that female students reported slightly higher instances of anxiety symptoms compared to male students.
- Interactive Capabilities: The dashboard incorporates various filters and parameters, enabling users to dynamically slice and dice the data by age group, gender, year of study, and specific mental health factors to gain granular insights.
5. Technical Tools
This project utilized the following key tools:
- Google Forms: For efficient collection of structured survey responses.
- Tableau Desktop: The primary tool for data visualization, including data preparation, developing various chart types, and implementing interactive features.
- Tableau Public: For publishing the final interactive dashboard, ensuring wide accessibility.
6. Project Impact & Applications
The findings and visualizations from this research offer significant value:
- Informing Support Services: Provides evidence-based insights for university counseling centers and student welfare departments to improve mental health support programs.
- Guiding Policy: Helps administrators understand mental health challenges affecting academic performance, leading to informed policy decisions.
- Promoting Well-being: Highlights the connection between mental health and CGPA, encouraging students to prioritize their well-being and seek help.
- Facilitating Research: Lays a foundation for more in-depth studies on specific mental health factors and interventions.
- Demonstrating Data-Driven Decisions: Showcases the application of data analysis and visualization to critical educational and social issues.
7. Conclusion
This project effectively demonstrates the power of data analysis and visualization in addressing complex issues like student mental health. By transforming survey data into compelling visual narratives in Tableau, it provides valuable insights into how mental well-being influences academic outcomes. This work underscores my ability to conduct thorough research, apply data visualization best practices, and deliver actionable insights that contribute positively to the educational community.